Price action trading is without a doubt the most popular trading concept.
Thanks to its relative simplicity, most traders end up running different varieties of price action trading strategies in their careers.
Different indicators accompany some; some are just naked price action charts.
This raises one obvious question.
Can be trading solely a price action a profitable way to tackle financial markets?
This is what we will cover in this article, but not only that.
I will explain the most important price dynamics and, more importantly, how and why markets are moving.
If you like this article, read the rest of the blog or join the Trading Masterclass for a comprehensive video course.
What won’t be covered in this article
If this is not your first visit to this blog, you might already know I don’t like to bother with basic things.
Internet is full of beginner trading education, and because of that, I won’t be explaining the fundamental basics of price action.
In other guides, in this blog, I tried to do my best to explain all the basics so everyone could understand, but this article would not mean covering Japanese candlesticks, what support and resistance is, and so on.
If you lack this knowledge, there are websites such as Babypips or Investopedia where you find plenty of resources to fill this gap.
My only recommendation for you be, don’t ever pay to learn the trading basics; some people sell the most simple knowledge for hundreds of dollars which is a waste of money as you can learn it for free.
Price is fractal
The first rule everyone who is trading price action should understand that price is fractal.
But what does that actually means?
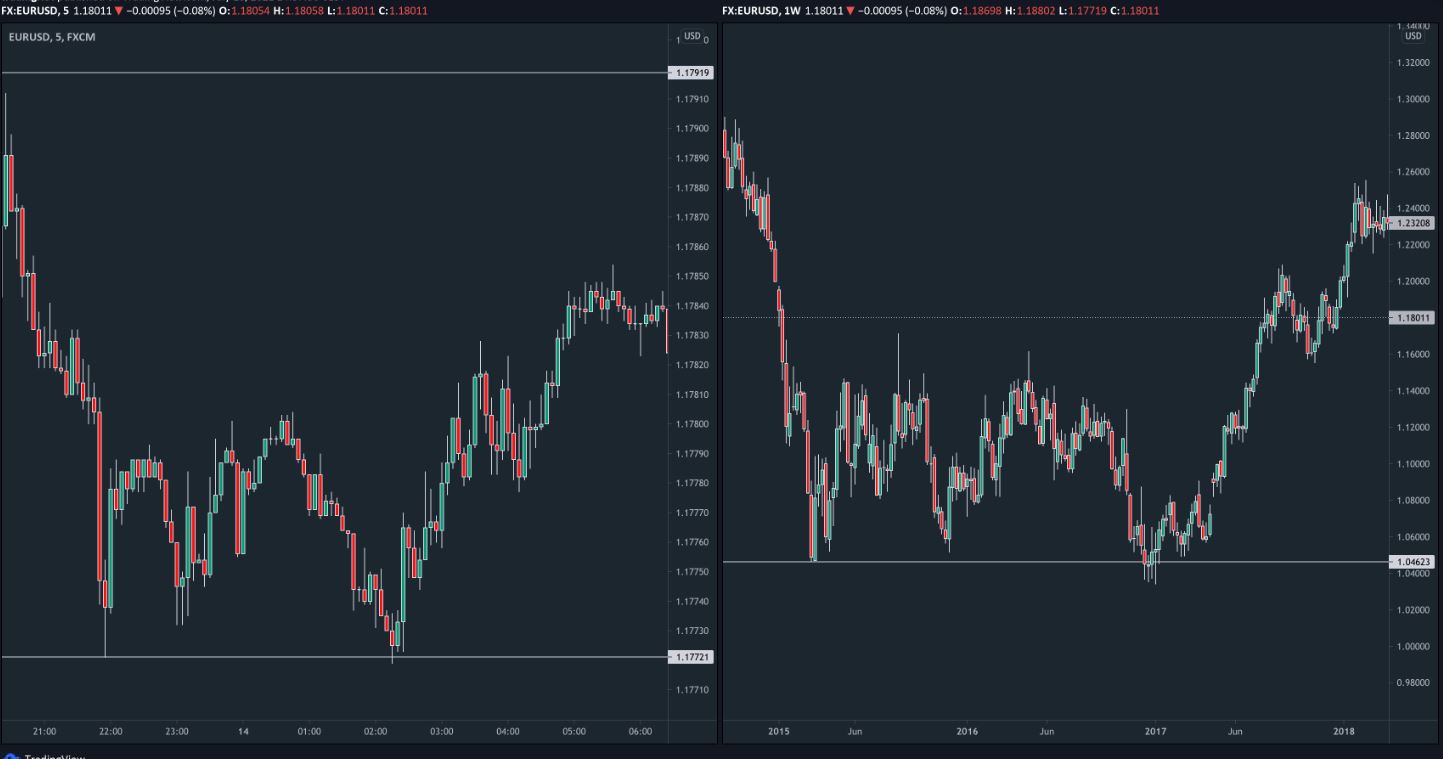
The chart above shows two very similar scenarios.
Market, in this case, EUR/USD, sold off, established support and rallied up after an unsuccessful attempt to break lower.
The main reason is that on the left chart, it took approximately 10 hours from the first support test to unsuccessful probe lower and rallied higher as we are looking at 5-minute timeframe candlestick chart.
We have a weekly timeframe chart on the right side, and the whole move took over 2 years to play out.
Every time you see different charts on the internet, you cannot tell the specific timeframe if you don’t study the given market closely.
The lesson in all of this is to understand that the fractal nature of the market tells us that the market dynamics and how moves initiate/end is the same across all timeframes.
Monthly trends can be spotted in advance on a weekly chart, same as hourly trends can be spotted on the 5-minute chart.
This alone should explain why the “lower timeframes are just noise, don’t bother looking at them” statement many educators use is nonsense.
Trading on the 5-minute chart is, in essence, the same as trading on the daily chart; the only difference is that more people watch higher timeframe levels; therefore, they attract much more attention and liquidity compared to lower timeframe support that gets completely irrelevant within few hours.
That is why lower timeframe levels can get less respected as only short term traders around them.
Although this is not an article about what trading approach you should choose, if we once again take a look at 5-minute vs Weekly timeframe example above, personally, I’d rather get a little more back, and forth market on the 5-minute chart than waiting months/years for one trading idea play out.
Sitting in positions for months/years is something large players can afford, but this is not the best way for most retail traders who want to participate in the market actively.
On top of that i’d also argue that you are more likely to predict market movement in the next hours/days than be able to say what will happen a year from now solely based on the price action chart.
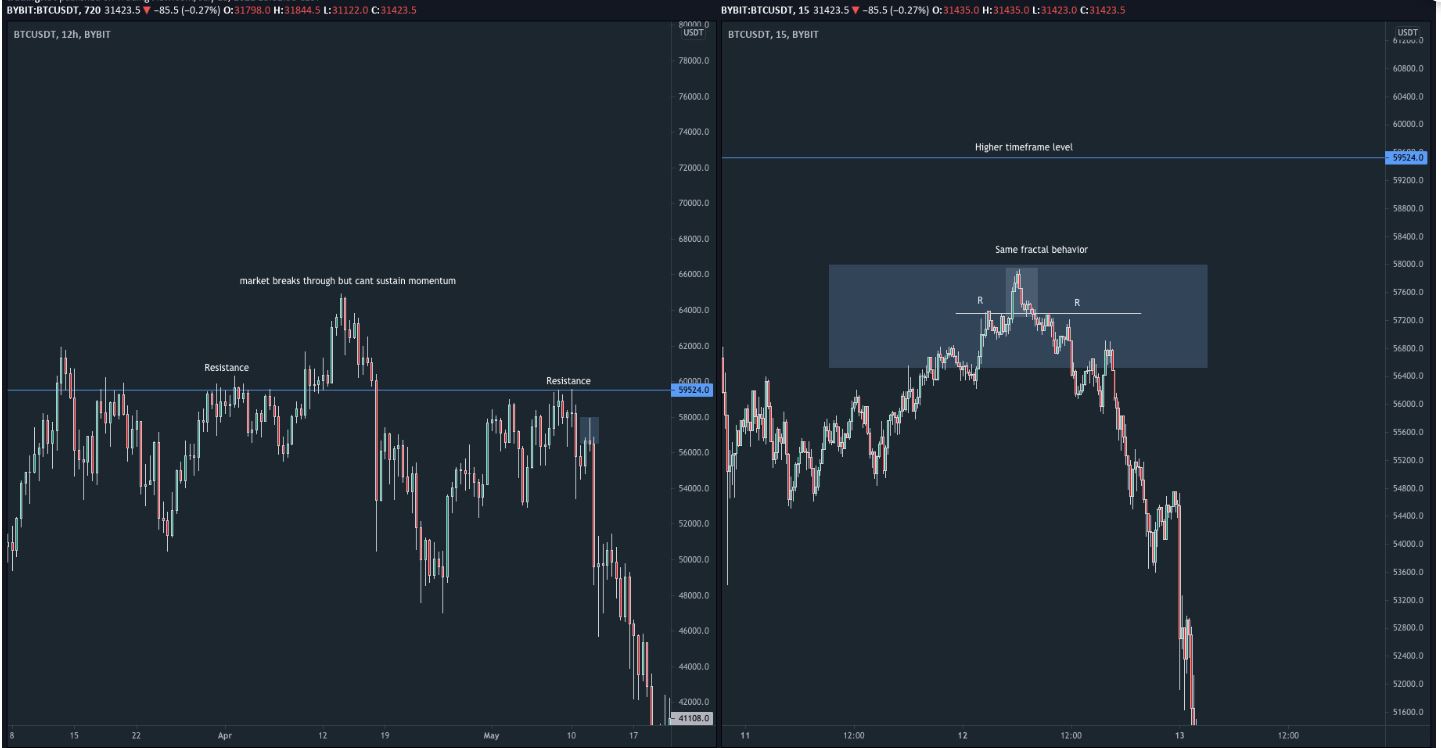
To drive this point home, take a look at the example above, which is a prime example of the fractal nature of price.
Of course, you will need much more than spot price behaviours for actual trading, but work on multiple timeframes and decompose charts to smaller timeframes while keeping your high timeframe levels/ideas in mind can generate highly EV+ trades.